Description: Professional 4-deck DJ software. Traktor is the go-to software for hundreds of thousands of DJs, at every level. Mix beyond the standard with freedom, flexibility, and powerful creative performance tools.
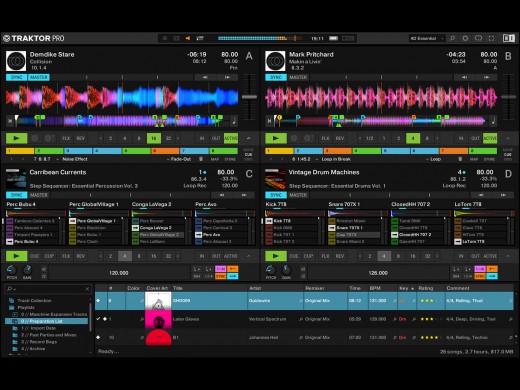
Thanks to ground-breaking technologies and relentless innovation, TRAKTOR PRO 4 offers an impressive array of features that allow you to fully utilise your creativity. From advanced remix tools, such as iZotope's AI-driven stem separation, to optimised effects, flexible beat grids, the innovative pattern player and the integrated iZotope Ozone Maximizer, which prevents recordings from clipping and distortion - every detail has been carefully designed to give you an unrivalled DJ experience.
TRAKTOR PRO 4 is the go-to choice for DJs worldwide, from casual mixers to festival headliners. Elevate your performance with next-generation tools, high-quality effects, and seamless hardware integration, all designed to give you complete control over your sound.
Take your DJ performances to new heights with TRAKTOR PRO 4, the industry-leading DJ software trusted by professionals worldwide. Whether you're mixing at home or headlining a festival, Traktor Pro 4 offers advanced tools, high-quality effects, and seamless hardware integration.
Enjoy ultimate control with features like 4-deck management, flexible beatgrids, and Ozone Maximizer. Enhance your creativity with studio-grade effects, stem separation, and iconic drum patterns. Compatible with all major DJ hardware, TRAKTOR PRO 4 ensures your sets are always in sync and sound amazing. Get started today and elevate your DJ experience with TRAKTOR PRO 4.
→ Key Features at a Glance:
• 4-Deck Control: Manage up to four decks in Track, Stem, and Remix Mode for a dynamic DJ experience.
• Reliable Sync: Keep your beats perfectly aligned with advanced, flexible beatgrids.
• Ozone Maximizer: Boost loudness with iZotope’s award-winning technology, maintaining clarity and dynamics.
• Studio-Grade Effects: Transform your tracks with over 40 Native Instruments effects.
• High-Quality Stem Separation: Isolate and manipulate drums, bass, instruments, and vocals with precision.
• Pattern Player: Add iconic drum patterns and sounds from top producers to your mix.
• Plug-and-Play Compatibility: Seamlessly integrate with CDJs, club mixers, and other DJ hardware.
• Smart Playlists: Efficiently organize your library and access millions of tracks with Beatport and Beatsource Streaming.
→ Creative Tools
Stem Separation
Transform the way you mix and remix with stem separation powered by iZotope’s legendary RX technology. Precisely isolate and manipulate drums, bass, instruments, and vocals. And with each stem waveform right in front of you, you can mute, control the volume, or apply filters and effects with a high level of accuracy.
Layer legendary drum sounds
Bring the sounds of iconic drum machines and leading producers to your sets. Pattern Player is packed with percussion kits, including the signature drums of industry legends like Rebekah, Luke Slater, Len Faki, Chris Liebing, and many more.
Studio-quality effects
Take your tracks to another dimension with iconic Traktor reverb, stretching algorithms, creative delays, and much more. Dial in and combine over 40 options across four assignable effect processors to twist, tweak, or totally transform your music.
Remix on the fly
Chop and re-edit tracks however you like with the industry’s most reliable loop, Hotcue, and beatjump tools. Plus, add samples and effects and trigger them in sync with the rest of the mix with Remix decks.
→ Performance
Flexible Beatgrids
Mixing disco? Hip hop? Jazz? No problem. Flexible beatgrids are ideal for moving between genres or mixing tracks with a changing tempo. Traktor Pro 4’s flexible beatgrids precisely follow each tempo change throughout the track. And unlike other DJ systems, there’s no impact on the audio quality when you hit sync. Get your mix sounding just right with highly-accurate looping, beat jumps, beat effect layering, and beat alignment.
Maximize your sound with Ozone
Take your sounds and sets to new heights while protecting the mix from clipping and distortion. Ozone Maximizer utilizes technology from iZotope’s award-winning Ozone mastering software. Its Intelligent Release Control allows you to boost the loudness of your sets without distortions.
Any setup you like
Plug and play with any club-standard mixer, turntables, or CDJs. Traktor Timecode Control Vinyl (DVS) means you can keep the feel of mixing vinyl with all your digital tracks, plus Beatport or Beatsource Streaming. And if you’re blurring the lines between DJing and performance, MIDI syncing and Ableton Link let you connect with external software and hardware to build extensive hybrid setups.
Pattern Player contributing producers
Over the past two decades, Traktor has continuously been shaped by feedback from our community and top artists.
With the introduction of Pattern Player, we’ve brought our favorite Traktor artists even closer. Thanks to Nicole Moudaber, Len Faki, Luke Slater, Chris Liebing, Rebekah, Dubfire and many more, we now have carefully curated signature sample kits for the whole community to use.
Stream your tracks
Get access to two months of free streaming directly connected to Traktor Pro 4 with Beatport Streaming Advanced or Beatsource Streaming. Explore and tag millions of tracks, and then mix them alongside the music in your own collection. Only available to new Beatport users.
Traktor Controllers
Create a setup that works for you with a huge range of controller options.
Traktor controllers
Get hands-on with your mix with Traktor S2, S4, X1, and Z1.
CDJs and mixers
Hook up Traktor to any compatible club-mixer or CDJs.
DVS systems
Keep the feel of DJing vinyl on your own turntables with Traktor Control Vinyl.
Manual MIDI integration
Create your own mappings in Traktor for just about any workflow you can think of.
Release Name: Native Instruments Traktor Pro 4.3.0.7
Size: 1.3 GB
Links: HOMEPAGE – NFO – Torrent Search
Download: RAPiDGATOR

